Graph Diagram
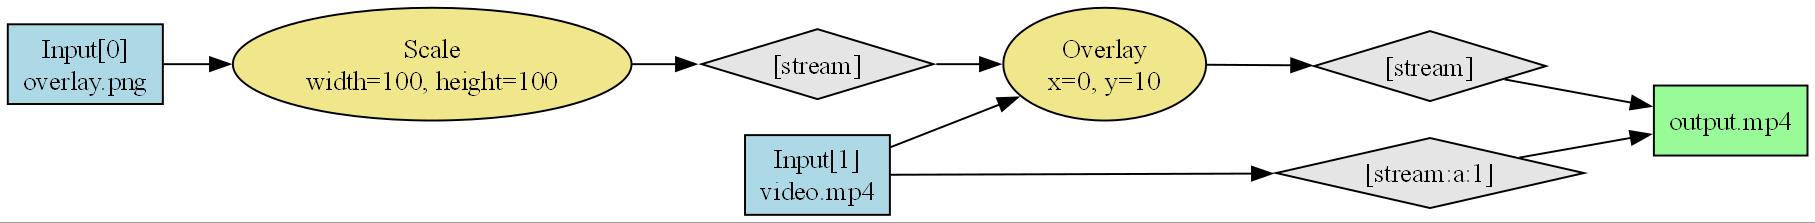
This Example shows how to create a filter graph diagram using ffmpeg-studio. It is often useful to visualize complex filter graphs for better understanding and debugging.
example/graph_diagram.py
from ffmpeg import (FFmpeg, FileInputOptions, InputFile, Map, apply,
                    draw_filter_graph)
from ffmpeg.filters import Overlay, Scale

# Do Filter as usual
ffmpeg = FFmpeg()

# Exmple filter graph
clip = InputFile("video.mp4", FileInputOptions(duration=10))
overlay = InputFile("overlay.png")

upscaled_clip = apply(Scale(1440, 1920), clip)
overlay = apply(Scale(100, 100), overlay)
upscaled_clip = apply(Overlay(overlay, x=0, y=10), clip)


ffmpeg.output(
    Map(upscaled_clip),
    Map(clip.get_stream(stream_name="a", stream_index=1)),
    path="output.mp4",
    vcodec="libx264",
)
# Use This Function for making drawing with graphviz
# You must install graphviz with pip and it is dependencies
draw_filter_graph(ffmpeg, "graph_output")